Recruitment metric 1. Sourcing channel effectiveness
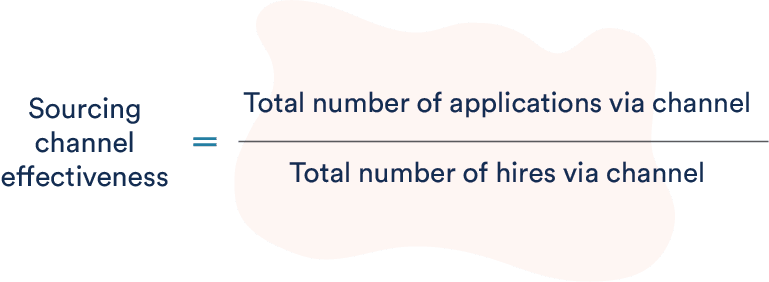
Why does sourcing channel effectiveness matter? Measuring sourcing channel effectiveness tells you which sourcing channels are delivering quality hires, and which aren’t. This can result in significant savings.
There is a difference between knowing where your applications come from and knowing the effectiveness of each sourcing channel. If you want to stop wasting budget and start investing in the channels that produce the most hires, you need to examine your sourcing channel effectiveness.
Let’s take a look at the numbers

Ask yourself:
- What is the cost per applicant for each of these channels?
- Which is driving the most hires?
- Which is delivering the best return on investment?

These figures represent the data in the previous graph in a different light. They show the number of applications required to make one successful hire via each sourcing channel.
The most successful channels: talent pipelines, internal mobility, and referrals, far outweigh the effectiveness of channels such as social media.

How has the effectiveness of sourcing channels changed year on year? Let’s compare 2020 —at the height of the pandemic —to 2021. It’s important to note that the effectiveness of most channels has increased but this is largely due to the applicant volume. Fewer applicants and more hires means each channel looks more effective.
Let’s look at a few key changes:
Internal mobility: In 2020, It took 11 internal applications via internal mobility to secure 1 hire. In 2021, it took only 9 applications via internal channels to find 1 hire. Many organizations have been focusing on improving their internal mobility strategies since the pandemic, as a way to redeploy talent and fill critical skills gaps in a tight talent market.
Company website: In 2020 it took 42 applications via a careers site to result in 1 hire, and in 2021 it took just 27 applications. Companies are getting much better at amplifying and selling their EVP on their careers site to attract quality candidates.
If you’re looking to improve your careers site’s sourcing effectiveness, consider implementing the following:
- Targeted landing pages exhibiting cultural initiatives like LGBTQIA+ or Women in STEM resource groups
- Employee-generated content and stories
- Video content that showcases your culture, benefits and values
- A clear mission and vision statement that inspires jobseekers
Next steps: Do you know the effectiveness of your sourcing channels? Ask yourself:
- What are our main sourcing channels?
- Where do the most applicants come from?
- Where do the most hires come from?
- What is the cost per hire per channel?
- How should our sourcing channel strategy change based on this?
Recruitment metric 2. Offer acceptance rate in 2022
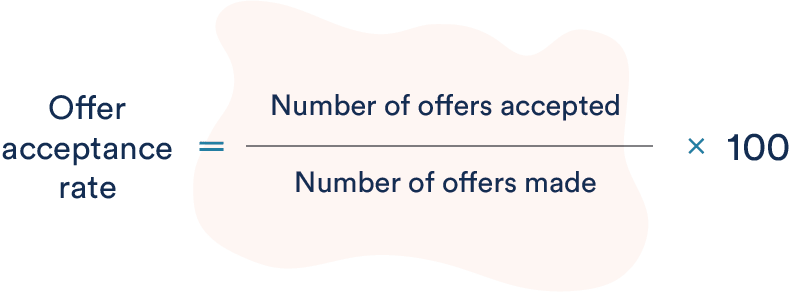
Why does it matter? Recruiting is expensive and each candidate that turns down a job offer costs your organization money. It’s a candidate’s market, and jobseekers can afford to be choosy: it’s likely they have multiple offers on the table. If you don’t provide a great recruiting experience, or if you’re too slow to make an offer, you risk losing hard-won talent at the final hurdle.
If you’re finding more and more candidates are saying ‘no’ at the final stages of the hiring process, you need to examine why. Tracking your offer acceptance rate will help you understand how you’re performing.
There is no benefit to having a low offer acceptance rate: each person that says ‘no’ costs your organization valuable time and resources. The best organizations average a 99% offer acceptance rate each year.
Rebecca Skilbeck, Head of Customer Insights & Market Research, PageUp
Offer acceptance rate in Higher Education
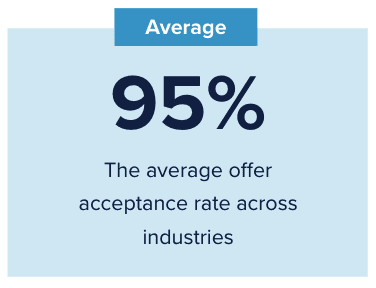
Our research found in 2021 the average offer acceptance rate across all industries in the US was 95% – which means for every 100 offers made, 95 people said “yes” and 5 said “no”.
Offer acceptance rates in Higher Education in particular have declined over the last two years —from 96% in 2019, to 95% in 2021 —and they now sit at 94% in 2022. This is significant as 6% of people saying “No” at the final offer stages costs your organization up to $23,860 per applicant. The time wasted on an uninterested candidate could mean you also lose your silver medallist candidate for the role.
The fall in offer acceptance rates during the pandemic may be attributed to uncertainty. Jobseekers felt uncertain about the employment market and were putting their feelers out for multiple different roles. Candidates were unsure if it was the right time to change roles, and were saying “yes” to an offer then rescinding their acceptance.
To improve your offer acceptance rate, make sure you discuss salary early, clearly articulate your culture and EVP early on in the recruitment process, and fast-track your hiring process to secure talent faster than the competition. You need to capture and track ‘why’ people are saying no to you. Don’t be afraid to ask the question – “why are you taking the other offer?”
If your offer acceptance rate is below the industry benchmark, ask yourself:
- Are you an employer of choice?
- Is your compensation competitive?
- Did something happen during the recruitment process?
- Is your recruitment process fast enough to secure talent?
Recruitment metric 3. Applicant to hire rate in 2022
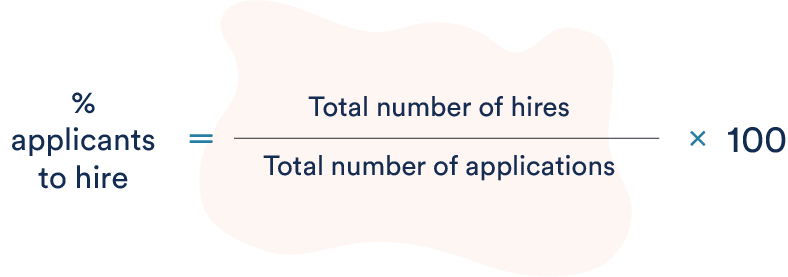
Why does your applicant to hire rate matter? This metric shows you how effective your job listings are. You don’t want to be wading through more applications than necessary, and you don’t want to be struggling to find enough talent for a role. Tracking applicant to hire rates can show whether your job listings are reaching and engaging the right audience.
Applicant to hire rate in Higher Education
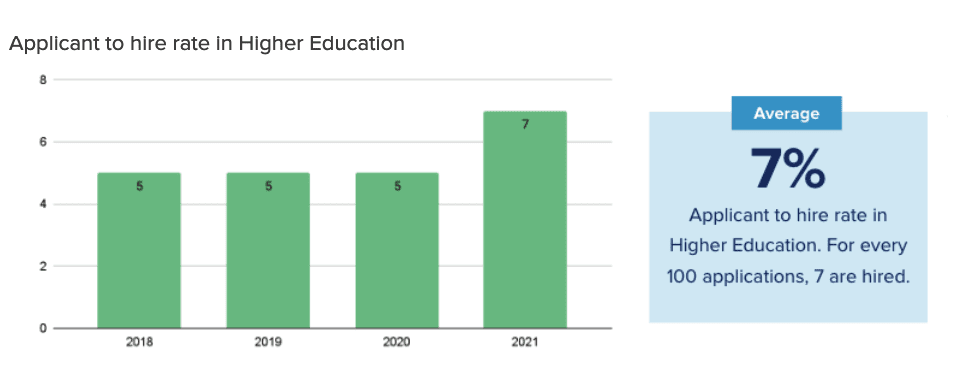
In 2021, 7% of all Higher Education applicants were hired. That means for every 100 applications received, 7 people were hired. This is a notable increase from previous years, where institutions only hired 5% of applicants.
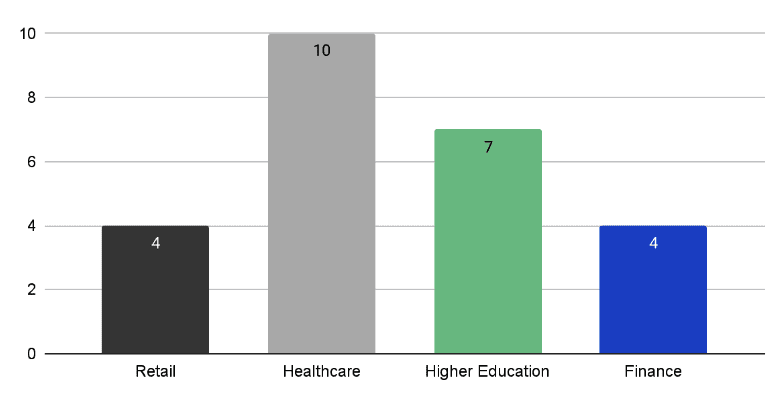
If you look at the average percentage of applicants each industry hires, Higher Education hires more applicants than industries like Retail and Finance.
-
Retail
-
Healthcare
-
Higher Education
-
Finance
Let’s deep dive: An increase in the applicant to hire rate is, on its face, a good thing. It means you’re getting a greater chunk of applicants that go on to be suitable hires. Remember: it’s about quality not quantity when it comes to applicants. You don’t want more applications, you want better applications. That means you’re posting targeted job ads, and poor-fit candidates are self-selecting out.
Is 7% the right volume for your organization? It will depend on your institution and the role. You may receive higher volumes for entry level positions and lower volumes for hard to fill or senior roles.
How many applications do you need for 1 hire?
You can use the applicant to hire rate to figure out roughly how many applications you might need to find 1 hire. If your applicant to hire rate is 7%, as a rule of thumb you’ll need around 14 applications to secure 1 hire. But is this consistent with the number of applicants institutions are receiving? No.
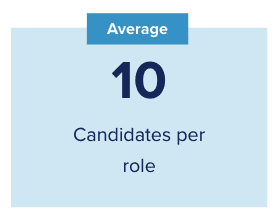
The number of applicants you can expect for a role has dropped from 16 in 2018 to 10 in 2021. This is a significant drop. This can be either a good or a bad thing, depending on your institution’s approach to talent acquisition. If you’re getting fewer applicants, but they are aligned with your culture, relevant and engaged, then this drop is good. It means fewer people going through the recruitment funnel, and more time to focus on high-quality candidates.
But if you’re struggling to find talent for your institution, this drop in applicants is worrying. You need to focus on your sourcing channels and make sure you’re getting in front of the right people and convincing them to apply.
Pros: Receiving fewer, but better applicants
- Fewer, higher-quality applicants reduces cost per hire
- Indicates job advertisements are detailed enough to allow people to self-select out. Only culturally-aligned people are applying
- You’ve managed to filter out irrelevant applications
- Your job ads are reaching the right audience
Cons: Getting too few applicants
- You may not be receiving enough quality applicants to meet your hiring needs
- Your job ads aren’t reaching the right audience
- Your job ads may not be appealing enough to convince people to apply
- Your EVP and employer brand may not be attractive to jobseekers
- You may be using ineffective sourcing channels
Too many applicants can create unnecessary work, while too few can limit your ability to find the best people.
Rebecca Skilbeck, Head of Customer Insights & Market Research, PageUp
Recruitment metric 4. Candidates to hire rate
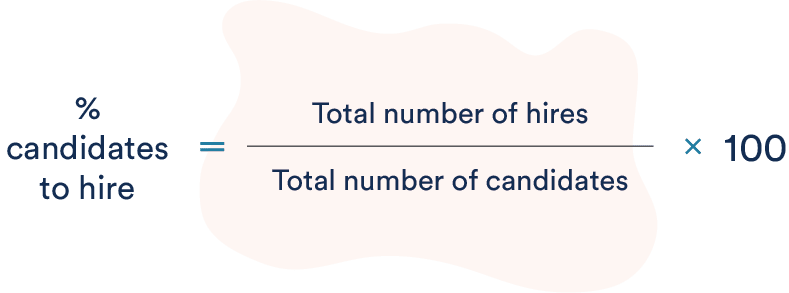
Why does your candidate to hire rate matter ? How many candidates are needed to find 1 hire? How many candidates should you be presenting to the hiring manager? A low candidate to hire % means you’re putting lots of people through to the hiring manager interview stage. This could cost an organization hundreds of thousands of dollars in recruitment fees and negatively impact your employer brand.
%Candidate hired in Higher Education
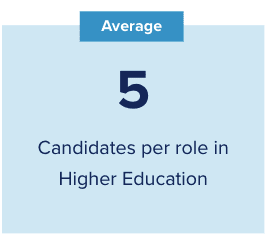
In 2021, 14% of all Higher Education candidates were hired, out of an average of 5 candidates per role. That means 14 out of every 100 candidates were given the role, and 86 were told “no”.
%Candidate hired globally in 2021
-
Retail
-
Healthcare
-
Higher Education
-
Finance
Globally, organizations hired an average of 13% of candidates in 2021. Healthcare and Higher Education hired the most candidates, and finance and retail hired fewer —just 10% and 9% respectively.
High or low? A low candidate to hire rate is undesirable. It means that you’re saying “no” to lots of candidates –which is costly, time consuming and affects your employer brand. It’s hard to have a high-touch, high-quality experience when you’re putting a lot of people through the process. Candidates aren’t afraid to share a bad recruitment experience: 72% of jobseekers have shared bad candidate experiences on sites like Glassdoor, on social media or directly with a colleague or friend.
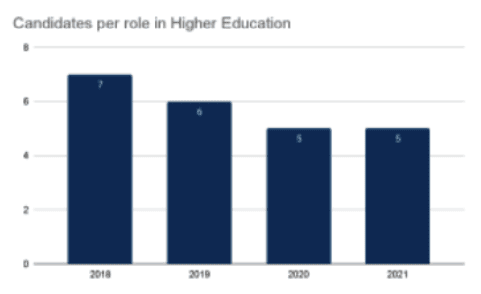
In 2021, recruiters put far fewer people through to the candidate stage: just 5 in 2021 compared to a high of 7 candidates in 2018. This could be because their screening tools are better, and they are presenting small numbers of high-quality candidates. Or it could be because that was all the talent they could get in such a competitive market.
Candidate per role in Higher Education
Pros: Getting fewer, but better candidates
- Better candidate experience because fewer people are going through the process
- Recruiters can provide a high touch approach to each candidate
- Faster recruitment process, don’t have to schedule as many assessments or interviews
- Better hiring manager experience: don’t have to review as many resumes or perform as many interviews
Cons: Getting too few quality candidates
- Having to spend more on job boards or agencies to get the volume of candidates required
- Having to keep the whole recruitment cycle open for longer: what’s the cost of these sourcing channels?
- Extended recruitment process: Candidates receive a poor experience because of a drawn out hiring process
Recruitment metric 5. Mobile applications and time to apply in 2022


Why does it matter? Remote tech has become an expectation, and jobseekers want to apply for roles quickly and easily, wherever and whenever it suits them. Companies need to deliver consumer-grade, mobile-optimized recruitment journeys to speed up the application process and attract top talent.
Mobile applications and time to apply rates are two separate metrics, but they work together to tell an important story. There are several key trends driving the adoption of mobile-optimized recruitment.
- Remote work is accelerating: As a result of the pandemic, 71% of US workers now work from home most of the time, according to Pew research center. With hybrid working models gaining momentum, organizations are expected to deliver seamless connectivity from any device at every stage of the recruitment process.
- 58% of job seekers look for roles on their phones. Making the job application process mobile-friendly will increase the number of job applicants by 11.6%.
- Baby boomers are retiring and millennials will make up 75% of the workforce by 2025.
- Smartphone adoption rates amongst casual, remote and blue collar workers is increasing.
Higher Education mobile apply rate
Globally, the average mobile application rate is 25% —1 in 4 applications are submitted on a mobile device. Higher Education has historically not seen high mobile application rates, in comparison with industries such as retail and manufacturing, which can see rates of up to 31 per cent.
In industries with high mobile usage, candidates expect to be able to search and apply for jobs with a few taps on their screen. If jobseekers find the application process frustrating, they may choose another employer who matches their technology expectations.

PageUp research has found that there is a correlation between abandoned job applications and applications made on a mobile device. As the application form lengthens, the number of incomplete applications via mobile devices increases. Lengthy job applications become tedious on these devices, applicants give up and they don’t complete the application. This doesn’t happen as often on desktop – although lengthy application forms are not recommended on any device.
Ask yourself:
- Is your careers site mobile-optimized?
- Do you offer applicants the opportunity to pre-fill from social sites/CVs?
- Are your job application forms suited to mobile usage?
Tips:
- Make application forms shorter
- Include screening questions so candidates can be moved through, or out, of the process quickly
- Try applying for a job using your own form: where can the process be streamlined?
- Search for a role on your career website using a mobile – was the process easy?
It’s never been more important to track and measure your recruitment metrics. Knowing what’s working and what needs attention can help HR take a seat at the decision-making table.
Learn more about how our powerful talent management technology can help you improve your recruitment strategy at pageuppeople.com
